|
|
| Energy & Resources Telecommunications Green Technology Automotive Transport & Logistics Infrastructure & Utilities IT Services Pharmacy & Life Science Retail Financial & Investment |
|
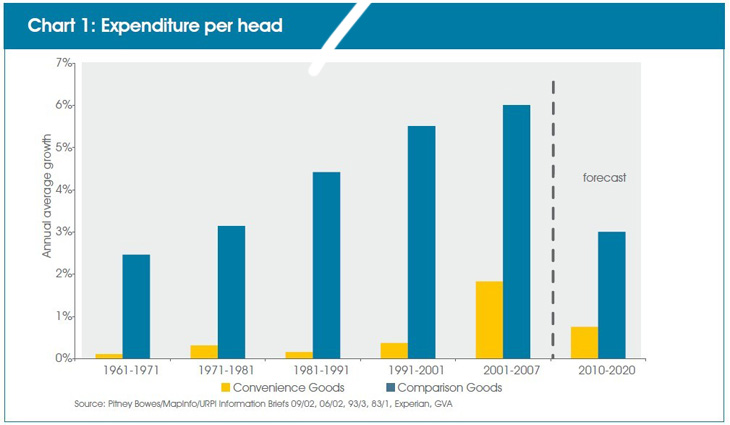
Retail spending growth The last 40 years (1968 쭯 2008) have seen retail expenditure per head grow at 2.8% pa. This is higher than consumer expenditure per head growth at 2.4% pa, which was more in line with overall economic growth. As incomes have risen, greater proportions have been spent on retail goods and in particular on comparison or non-food goods, fuelling the demand for retail floorspace. Growth in spending per head on comparison (non-food) goods has been exceptional. Chart 1 shows it accelerating from an average of just under 3% pa during the 1960s and 1970s to just over 4% pa in the 1980s, 5.5% pa in the 1990s and 6% pa from 2001 to 2007. In contrast spending on food has grown at a slow, steady rate of c.0.5% pa.
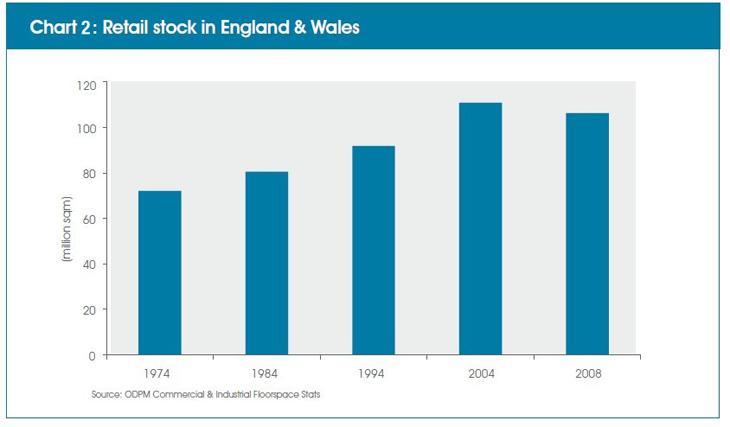
Retail stock in England and Wales has grown steadily over the last 40 years.Between 1971 and 2004 the total stock increased by 54% from 72.1 million sqm to over 110 million sqm. Direct comparisons with more recent figures are not possible due to definitional changes.Chart 2 shows the pace of development has accelerated with strongest growth 1994-2004 (+21%) compared with growth of 12-14% over the previous two decades.
|
|
|||
| Address: Suite C305, Changjiang Software Park, 180 South Changjiang Road, Shanghai, China, 200439 Tel:021-3650 3657 Fax:021-5186 1548 Email: info@umsinstitute.com Copyright@2003-2022 UMS Institute, All rights Reserved 빴ICP구18024339뵀 | |||