|
|
|
2010 was a challenging year for all. Heavily influenced by the worst recession since the 1930s, economic conditions remained precarious and demanded everyone's full attention. That combined with the most hotly contested General Election for a generationĻCand one where the result was even more surprising than any opinion poll had suggested ĻC ensured that 2010 was something of a roller coaster ride for the logistics industry.
The logistics sector faced a particularly challenging business environment in 2010 with businesses having to contend with rapidly rising input prices over which they have no control, and weak levels of business activity as the economy saw only modest growth.
Logistics operating costs
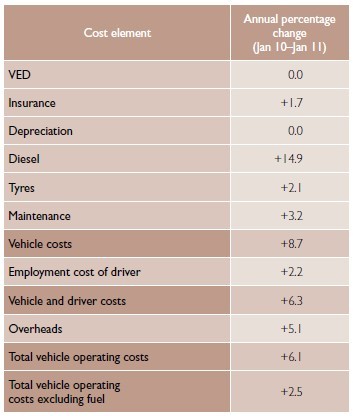
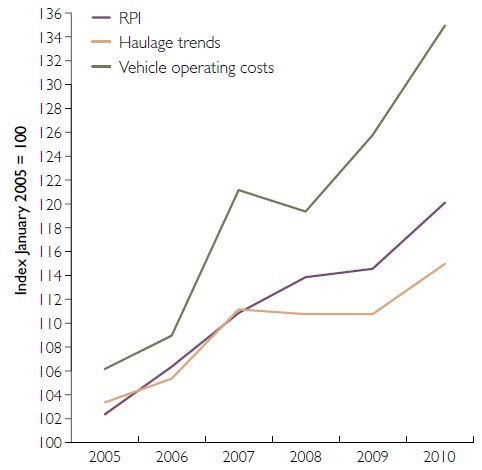
With pressure on margins as a result of weak business volumes and higher input costs, many businesses have looked for ways to reduce costs; 90 percent of CEOs in the transport and logistics industry said they implemented cost-reduction initiatives in 20102. UMSĄŊs ManagerĄŊs Guide to Distribution Costs shows that in the year to January 2011, whilst operating costs rose by 6.1 percentĻCwell above inflation ĻC road haulage rates rose by just 3.6 percent(see table 1.1 and graph 1.2). This shortfall in margins leaves businesses with little choice but to cut costs, for example by scaling back plans for future investment, even though this leaves them with the business risks associated with ageing assets and IT systems.
Table 1.1 Percentage annual change in hgv operating cost components (January 2011) |
|
|||
| Address: Suite C305, Changjiang Software Park, 180 South Changjiang Road, Shanghai, China, 200439 TelĢš021-3650 3657 FaxĢš021-5186 1548 Email: info@umsinstitute.com Copyright@2003-2022 UMS Institute, All rights Reserved ŧĶICPąļ18024339šÅ | |||