|
|
| 能源与资源 通信 绿色技术 汽车产业 交通及运输 基础设施和公共事业 IT服务 药学及生命科学 零售 金融及保险 |
Energy & Res![]()
|
This chapter summarizes data on current investment flows related to energy supply. The information on current investment flows relates to economic sectors.
Components of energy supply are divided between two economic sectors. Specifically: ● Oil, gas and coal production and petroleum refining are part of the mining and quarrying sector, together with other mining activities; ● Electricity generation, T&D and gas distribution are part of electricity, gas distribution and water supply sector.
The electricity, gas distribution and water supply sector accounts for the largest share of energy supply investment. The sources of investment are shown in table I-1.
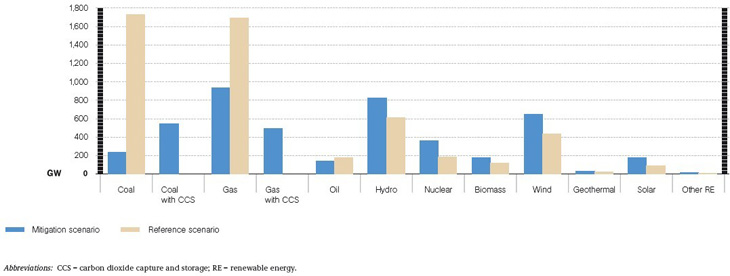
Table I-1. Investment flows for electricity, gas distribution and water supply in 2000 (percentage), by source and region 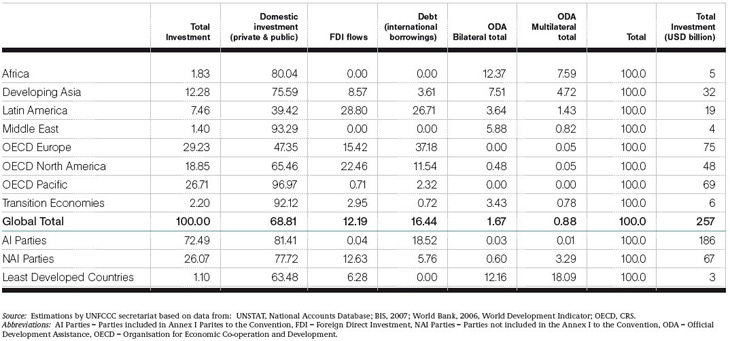 Increased energy efficiency also limits the rate of growth of global electricity demand under the mitigation scenario to 27,983 TWh in 2030. The mitigation scenario also assumes a substantial shift in the global electricity generation mix in 2030. As shown in figure I-2, coal remains the largest source of electricity (and generation capacity increases by 95 gigawatt (GW)) but its share shrinks from 40 per cent in 2004 to 26 per cent in 2030.
Gas-fired generation grows rapidly and becomes the second largest source at 21 per cent in 2030. The generation capacity of nuclear energy, hydropower and renewables expands significantly, each representing about 17 percent of the total in 2030. The mitigation scenario assumes a significant amount of CCS for power plants and industry.By 2030 CCS is added to 70 per cent of the new coal capacity (545 GW) and 35 per cent of new gas capacity (494 GW).
Figure I-2. Cumulative capacity additions in the reference and mitigation scenarios, 2004 – 2030
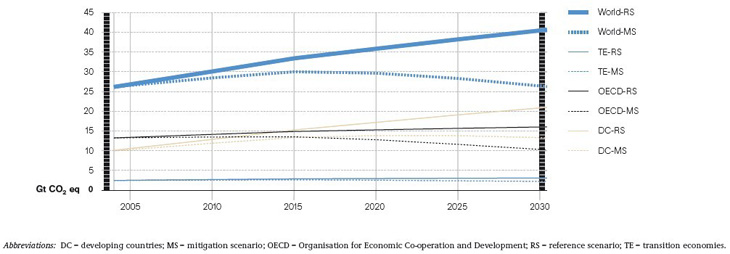
Global energy-related CO2 emissions peak at 30 Gt CO2 between 2015 and 2020 and decrease to the current levels by 2030 (see figure I-3). Emissions of OECD countries remain stable from 2004 to 2015 and then decrease to 10 Gt CO2 by 2030, 7 per cent below their 1990 emissions. Developing country emissions increase by 3.3 Gt CO2 then start to decline by 2030.The trend for emissions in transition economies is to decrease slightly under the mitigation scenario, rather than increasing slightly under the reference scenario.
Figure I-3. Energy-related carbon dioxide emissions under the reference and mitigation scenarios, 2004 – 2030
|
|
|||
| 公司地址:长江南路180号长江软件园C区305室,200439,中国,上海 电话:021-3650 3657 传真:021-5186 1548 邮箱: info@umsinstitute.com Copyright@2003-2022 UMS Institute, All rights Reserved 沪ICP备18024339号 |
|||